

2.1. EFK(Elasticsearch-Fluent Bit-Kibana) 구성
Helm은 쿠버네티스 패키지를 관리해주는 도구이다.
Helm에서 사용되는 차트는 리소스를 하나로 묶은 패키지에 해당하며, Helm으로 차트를 관리하는 목적은 자칫 번잡해지기 쉬운 매니페스트 파일을 관리하기 쉽게 하기 위함이다.
그리고 설치할 때마다 릴리스 버전이 생성되고 새로운 차트를 찾을때에는 Helm chart repository에서 찾을 수 있다.
Helm 다음 명령어로 간단하게 설치가 가능하다.
$ curl -fsSL -o get_helm.sh https://raw.githubusercontent.com/helm/helm/master/scripts/get-helm-3
$ chmod 700 get_helm.sh
$ ./get_helm.sh
Helm이 정상적으로 설치되면 차트 레포지토리를 추가하고 업데이트 해준다.
$ helm repo add stable https://kubernetes-charts.storage.googleapis.com/
"stable" has been added to your repositories

$ helm repo update
Hang tight while we grab the latest from your chart repositories...
...Successfully got an update from the "stable" chart repository
Update Complete. ⎈Happy Helming!⎈
여기까지만 해주어도 Helm을 사용할 준비가 끝난 것이다.
모니터링 환경을 구축하기 위해 앞서 설치한 Helm을 사용하여 Prometheus와 Grafana를 쿠버네티스에 설치할 것이다.
먼저 모니터링을 위한 네임스페이스를 생성해준다.
$ kubectl create namespace monitoring
namemonitoring created
생성된 네임스페이스에 다음 명령어를 통해 prometheus-operator를 설치해준다.
$ helm install prometheus stable/prometheus-operator --namespace monitoring
WARNING: This chart is deprecated
manifest_sorter.go:192: info: skipping unknown hook: "crd-install"
manifest_sorter.go:192: info: skipping unknown hook: "crd-install"
manifest_sorter.go:192: info: skipping unknown hook: "crd-install"
manifest_sorter.go:192: info: skipping unknown hook: "crd-install"
manifest_sorter.go:192: info: skipping unknown hook: "crd-install"
manifest_sorter.go:192: info: skipping unknown hook: "crd-install"
NAME: prometheus
LAST DEPLOYED: Sun Oct  4 07:36:07 2020
NAMESPACE: monitoring
STATUS: deployed
REVISION: 1
NOTES:
*******************
*** DEPRECATED ****
*******************
* stable/prometheus-operator chart is deprecated.
* Further development has moved to https://github.com/prometheus-community/helm-charts
* The chart has been renamed kube-prometheus-stack to more clearly reflect
* that it installs the `kube-prometheus` project stack, within which Prometheus
* Operator is only one component.

The Prometheus Operator has been installed. Check its status by running:
kubectl --namespace monitoring get pods -l "release=prometheus"

Visit https://github.com/coreos/prometheus-operator for instructions on how
to create & configure Alertmanager and Prometheus instances using the Operator.
Prometheus와 Grafana가 재대로 동작하는지 확인해본다.
$ kubectl get all -n monitoring
NAME                                                         READY   STATUS    RESTARTS   AGE
pod/alertmanager-prometheus-prometheus-oper-alertmanager-0   2/2     Running   0          10m
pod/prometheus-grafana-7db88cd4c6-nff9b                      2/2     Running   0          10m
pod/prometheus-kube-state-metrics-6b46f67bf6-n8pxk           1/1     Running   0          10m
pod/prometheus-prometheus-node-exporter-d4zfh                1/1     Running   0          10m
pod/prometheus-prometheus-node-exporter-dkjrj                1/1     Running   0          10m
pod/prometheus-prometheus-node-exporter-zv7t9                1/1     Running   0          10m
pod/prometheus-prometheus-oper-operator-7c75ff5864-z85j8     2/2     Running   0          10m
pod/prometheus-prometheus-prometheus-oper-prometheus-0       3/3     Running   0          10m

NAME                                              TYPE        CLUSTER-IP       EXTERNAL-IP   PORT(S)                      AGE
service/alertmanager-operated                     ClusterIP   None             <none>        9093/TCP,9094/TCP,9094/UDP   10m
service/prometheus-grafana                        ClusterIP   10.104.145.38    <none>        80/TCP                       10m
service/prometheus-kube-state-metrics             ClusterIP   10.109.220.132   <none>        8080/TCP                     10m
service/prometheus-operated                       ClusterIP   None             <none>        9090/TCP                     10m
service/prometheus-prometheus-node-exporter       ClusterIP   10.104.66.36     <none>        9100/TCP                     10m
service/prometheus-prometheus-oper-alertmanager   ClusterIP   10.100.159.72    <none>        9093/TCP                     10m
service/prometheus-prometheus-oper-operator       ClusterIP   10.99.75.140     <none>        8080/TCP,443/TCP             10m
service/prometheus-prometheus-oper-prometheus     NodePort    10.107.124.62    <none>        9090/TCP                     10m

NAME                                                 DESIRED   CURRENT   READY   UP-TO-DATE   AVAILABLE   NODE SELECTOR   AGE
daemonset.apps/prometheus-prometheus-node-exporter   3         3         3       3            3           <none>          10m
Prometheus와 Grafana가 정상적으로 동작하면 NodePort를 생성하여 생성된 Prometheus와 Grafana 서비스에 접근할 수 있다.
본 프로젝트에서는 Prometheus의 포트번호를 31111, Grafana의 포트번호를 31112로 정하였고, GCP 방화벽에서도 해당 포트를 열어준다.
$ vim prometheus_nodeport.yaml
apiVersion: v1
kind: Service
metadata:
name: prometheus
spec:
type: NodePort
selector:
    app: prometheus
    prometheus: prometheus-prometheus-oper-prometheus
ports:
    - protocol: TCP
    port: 9090
    targetPort: 9090
    nodePort: 31111

$ vim grafana_nodeport.yaml
apiVersion: v1
kind: Service
metadata:
name: grafana
spec:
type: NodePort
selector:
    app.kubernetes.io/instance: prometheus
    app.kubernetes.io/name: grafana
ports:
    - protocol: TCP
    port: 3000
    targetPort: 3000
    nodePort: 31112

$ kubectl create -f prometheus_nodeport.yaml -n monitoring
$ kubectl create -f grafana_nodeport.yaml -n monitoring
kube-masterIP:31111 URL로 접속하여 상단 메뉴의 Status > Targets에 들어가보면 다음 [그림 1]과 같이 에러가 발생되어 있을 수 있다.
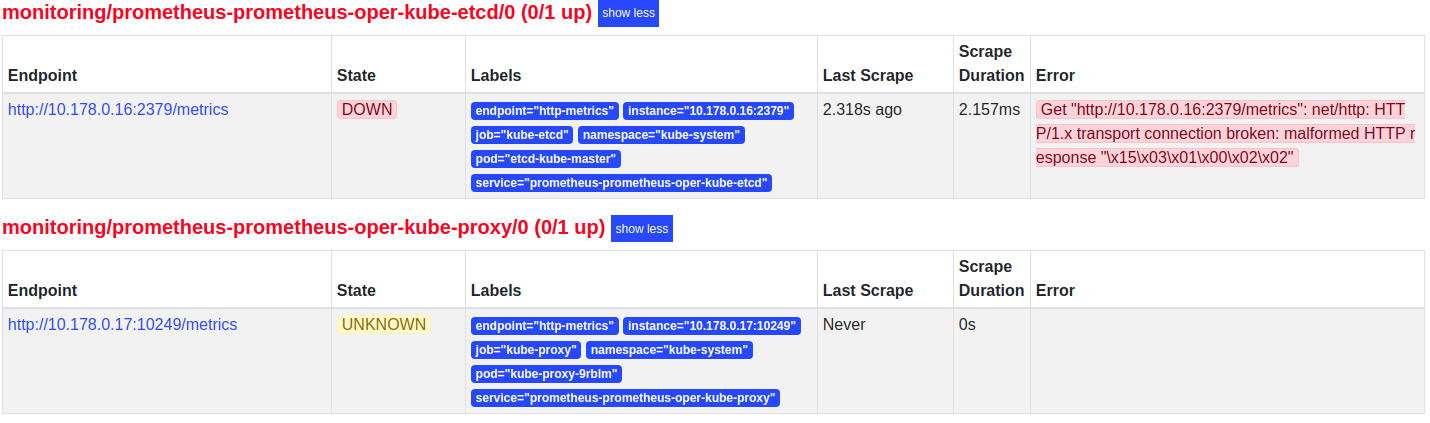 |
|---|
| [그림 1] kube-proxy와 kube-etcd 에러 |
kube-proxy는 메트릭 바인드 주소가 기본적으로 localhost로 잡혀있을 것이다.
$ kubectl edit cm/kube-proxy -n kube-system
...(중략)
kind: KubeProxyConfiguration
metricsBindAddress: 0.0.0.0:10249
...(중략)

$ kubectl delete pod -l k8s-app=kube-proxy -n kube-system
metricsBindAddress 값을 위와 같이 0.0.0.0으로 바꿔주고 기존의 kube-proxy 파드를 제거하여 재생성 되도록 해주면 Prometheus에서 kube-proxy가 정상적으로 작동할 것이다.
다음으로 kube-etcd는 https 인증서 설정이 재대로 되어있지 않아서 생기는 문제이다.
prometheus-operator를 배포할 때 Helm 차트의 values.yaml 파일을 다음과 같이 수정한다.
$ vim values.yaml
serviceMonitor:
    scheme: https
    insecureSkipVerify: false
    serverName: localhost
    caFile: /etc/prometheus/secrets/etcd-client-cert/etcd-ca
    certFile: /etc/prometheus/secrets/etcd-client-cert/etcd-client
    keyFile: /etc/prometheus/secrets/etcd-client-cert/etcd-client-key

    secrets:
    - "etcd-client-cert"
values.yaml 파일을 수정하고 caFile, certFile, keyFile에 맞는 시크릿을 생성해주어야 한다.
$ POD_NAME=$(kubectl get pods -o=jsonpath='{.items[0].metadata.name}' -l component=kube-apiserver -n kube-system)
$ kubectl create secret generic etcd-client-cert -n monitoring \
--from-literal=etcd-ca="$(kubectl exec $POD_NAME -n kube-system -- cat /etc/kubernetes/pki/etcd/ca.crt)" \
--from-literal=etcd-client="$(kubectl exec $POD_NAME -n kube-system -- cat /etc/kubernetes/pki/etcd/healthcheck-client.crt)" \
--from-literal=etcd-client-key="$(kubectl exec $POD_NAME -n kube-system -- cat /etc/kubernetes/pki/etcd/healthcheck-client.key)"
secret/etcd-client-cert created
etcd-client-cert 시크릿을 만들어주고 수정된 values.yaml 파일을 바탕으로 다시 prometheus-operator를 배포하면 etcd의 통신 에러도 해결 될 것이다.
Helm에 value.xml 파일을 따로 수정하지 않으면 기본적으로 Grafana의 ID는 admin, 패스워드는 prom-operator로 설정되어 있다.
참고로 초기 패스워드는 values.yaml 파일에서 수정할 수 있다.
kube-masterIP:31112 URL로 접속하여 Grafana 대시보드가 Prometheus에서 수집된 메트릭을 잘 수집하여 시각화되어지는지 확인해본다.
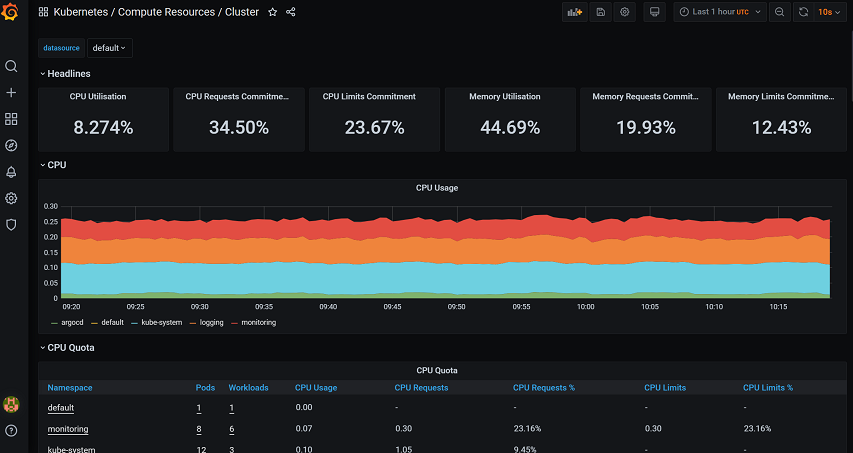 |
|---|
| [그림 2] Grafana 대시보드 확인 |
위의 [그림 2]에서와 같이 쿠버네티스 클러스터에 대한 메트릭이 잘 수집되어 시각화해주는 것을 확인할 수 있다.
로깅 환경을 구축하기 위해 Helm을 사용하여 EFK를 쿠버네티스에 설치할 것이다.
먼저 EFK 차트 레포지토리를 추가 및 업데이트를 해준다.
$ helm repo add akomljen-charts https://raw.githubusercontent.com/komljen/helm-charts/master/charts/
$ helm repo update
그런 다음 모니터링과 마찬가지로 로깅을 위한 네임스페이스를 생성해준다.
$ kubectl create namespace logging
elasticsearch-master와 elasticsearch-data에서 사용할 PV를 미리 각각 생성해주어야 PVC가 정상적으로 바인딩 되어 Elasticsearch 노드들이 정상적으로 동작된다.
$ vim elastic-pv.yaml
apiVersion: v1
kind: PersistentVolume
metadata:
name: es-data-es-master-efk-cluster-default-0
labels:
    cluster: efk-cluster
    component: elasticsearch-efk-cluster
    name: es-master-efk-cluster-default
    role: master
spec:
capacity:
    storage: 10Gi
accessModes:
    - ReadWriteOnce
hostPath:
    path: "/mnt/data"

---
apiVersion: v1
kind: PersistentVolume
metadata:
name: es-data-es-data-efk-cluster-default-0
labels:
    cluster: efk-cluster
    component: elasticsearch-efk-cluster
    name: es-data-efk-cluster-default
    role: data
spec:
capacity:
    storage: 10Gi
accessModes:
    - ReadWriteOnce
hostPath:
    path: "/mnt/data"

$ kubectl create -f elastic-pv.yaml -n logging

$ kubectl get pv,pvc -n logging
NAME                                                       CAPACITY   ACCESS MODES   RECLAIM POLICY   STATUS   CLAIM                                             STORAGECLASS   REASON   AGE
persistentvolume/es-data-es-data-efk-cluster-default-0     10Gi       RWO            Retain           Bound    logging/es-data-es-data-efk-cluster-default-0                             15m
persistentvolume/es-data-es-master-efk-cluster-default-0   10Gi       RWO            Retain           Bound    logging/es-data-es-master-efk-cluster-default-0                           15m

NAME                                                            STATUS   VOLUME                                    CAPACITY   ACCESS MODES   STORAGECLASS   AGE
persistentvolumeclaim/es-data-es-data-efk-cluster-default-0     Bound    es-data-es-data-efk-cluster-default-0     10Gi       RWO                           15m
persistentvolumeclaim/es-data-es-master-efk-cluster-default-0   Bound    es-data-es-master-efk-cluster-default-0   10Gi       RWO                           15m
PV를 정상적으로 생성하고 PVC가 바운드된 것이 확인되면 다음 명령어를 통해 EFK를 설치해준다.
$ helm install efk --namespace logging akomljen-charts/efk

$ kubectl get all -n logging
NAME                                                    READY   STATUS      RESTARTS   AGE
pod/efk-elasticsearch-curator-1602579600-rcwk8          0/1     Completed   0          15m
pod/efk-kibana-676fb9dbd4-rx5xv                         1/1     Running     0          15m
pod/elasticsearch-operator-sysctl-fl7jd                 1/1     Running     0          15m
pod/elasticsearch-operator-sysctl-mgsxp                 1/1     Running     0          15m
pod/es-client-efk-cluster-5f65d7f687-hpm65              1/1     Running     0          15m
pod/es-data-efk-cluster-default-0                       1/1     Running     0          15m
pod/es-master-efk-cluster-default-0                     1/1     Running     0          15m
pod/es-operator-elasticsearch-operator-876b46db-s84t8   1/1     Running     0          15m
pod/fluent-bit-s5j8z                                    1/1     Running     0          15m
pod/fluent-bit-spwj2                                    1/1     Running     0          15m


NAME                                          TYPE        CLUSTER-IP       EXTERNAL-IP   PORT(S)         AGE
service/efk-kibana                            ClusterIP   10.111.218.138   <none>        443/TCP         15m
service/elasticsearch-discovery-efk-cluster   ClusterIP   10.103.53.150    <none>        9300/TCP        15m
service/elasticsearch-efk-cluster             ClusterIP   10.108.108.5     <none>        9200/TCP        15m
service/es-data-svc-efk-cluster               ClusterIP   10.107.231.1     <none>        9300/TCP        15m

NAME                                           DESIRED   CURRENT   READY   UP-TO-DATE   AVAILABLE   NODE SELECTOR                 AGE
daemonset.apps/elasticsearch-operator-sysctl   2         2         2       2            2           beta.kubernetes.io/os=linux   15m
daemonset.apps/fluent-bit                      2         2         2       2            2           <none>                        15m

NAME                                                 READY   UP-TO-DATE   AVAILABLE   AGE
deployment.apps/efk-kibana                           1/1     1            1           15m
deployment.apps/es-client-efk-cluster                1/1     1            1           15m
deployment.apps/es-operator-elasticsearch-operator   1/1     1            1           15m

NAME                                                          DESIRED   CURRENT   READY   AGE
replicaset.apps/efk-kibana-676fb9dbd4                         1         1         1       15m
replicaset.apps/es-client-efk-cluster-5f65d7f687              1         1         1       15m
replicaset.apps/es-operator-elasticsearch-operator-876b46db   1         1         1       15m

NAME                                             READY   AGE
statefulset.apps/es-data-efk-cluster-default     1/1     15m
statefulset.apps/es-master-efk-cluster-default   1/1     15m

NAME                                             COMPLETIONS   DURATION   AGE
job.batch/efk-elasticsearch-curator-1602579600   1/1           2s         15m

NAME                                      SCHEDULE    SUSPEND   ACTIVE   LAST SCHEDULE   AGE
cronjob.batch/efk-elasticsearch-curator   0 * * * *   False     0        15m             15m
EFK가 정상적으로 설치되면 NodePort 서비스를 생성하여 외부에서 접근 가능하도록 해준다.
$ vim kibana-nodeport.yaml
apiVersion: v1
kind: Service
metadata:
name: kibana
spec:
type: NodePort
selector:
    app: kibana
    release: efk
ports:
    - protocol: TCP
    port: 443
    targetPort: 5601
    nodePort: 30443

$ kubectl create -f kibana-nodeport.yaml -n logging
마찬가지로 Kibana에 접근할 30443 포트는 GCP 방화벽에서도 열어주어야 접근이 가능하다.
이렇게 Kibana에 접근하더라도 한 가지 문제가 있다.
Fluent Bit에서 쿠버네티스 클러스터의 로그를 수집할 때 /var/log/containers에 존재하는 로그 파일을 읽어들이는데, journald 드라이버를 사용하여 컨테이너 로그를 수집하게 되어 있어 /var/log/containers 폴더에 로그가 쌓이지 않는 문제가 있다.
그래서 Kibana에 접속하더라도 생성할 인덱스 패턴이 존재하지 않았었는데, 문제를 해결하기 위해 다음과 같이 수정해야 한다.
$ vim /etc/sysconfig/docker
OPTIONS='--selinux-enabled --signature-verification=false'
모든 쿠버네티스 클러스터에서 /etc/sysconfig/docker 파일에 존재하는 --log-driver = journald 부분을 제거해야 도커 컨테이너 로그가 /var/log/containers 경로에 쌓이게 되고, Fluent Bit에서 해당 로그들을 수집하여 Kibana에서 인덱스 패턴을 생성할 수 있게 된다.
정상적으로 로그가 쌓이게 되면 다시 Kibana에 접속하여 Kubernetes_cluster-*이라는 인덱스 패턴을 생성해준다.
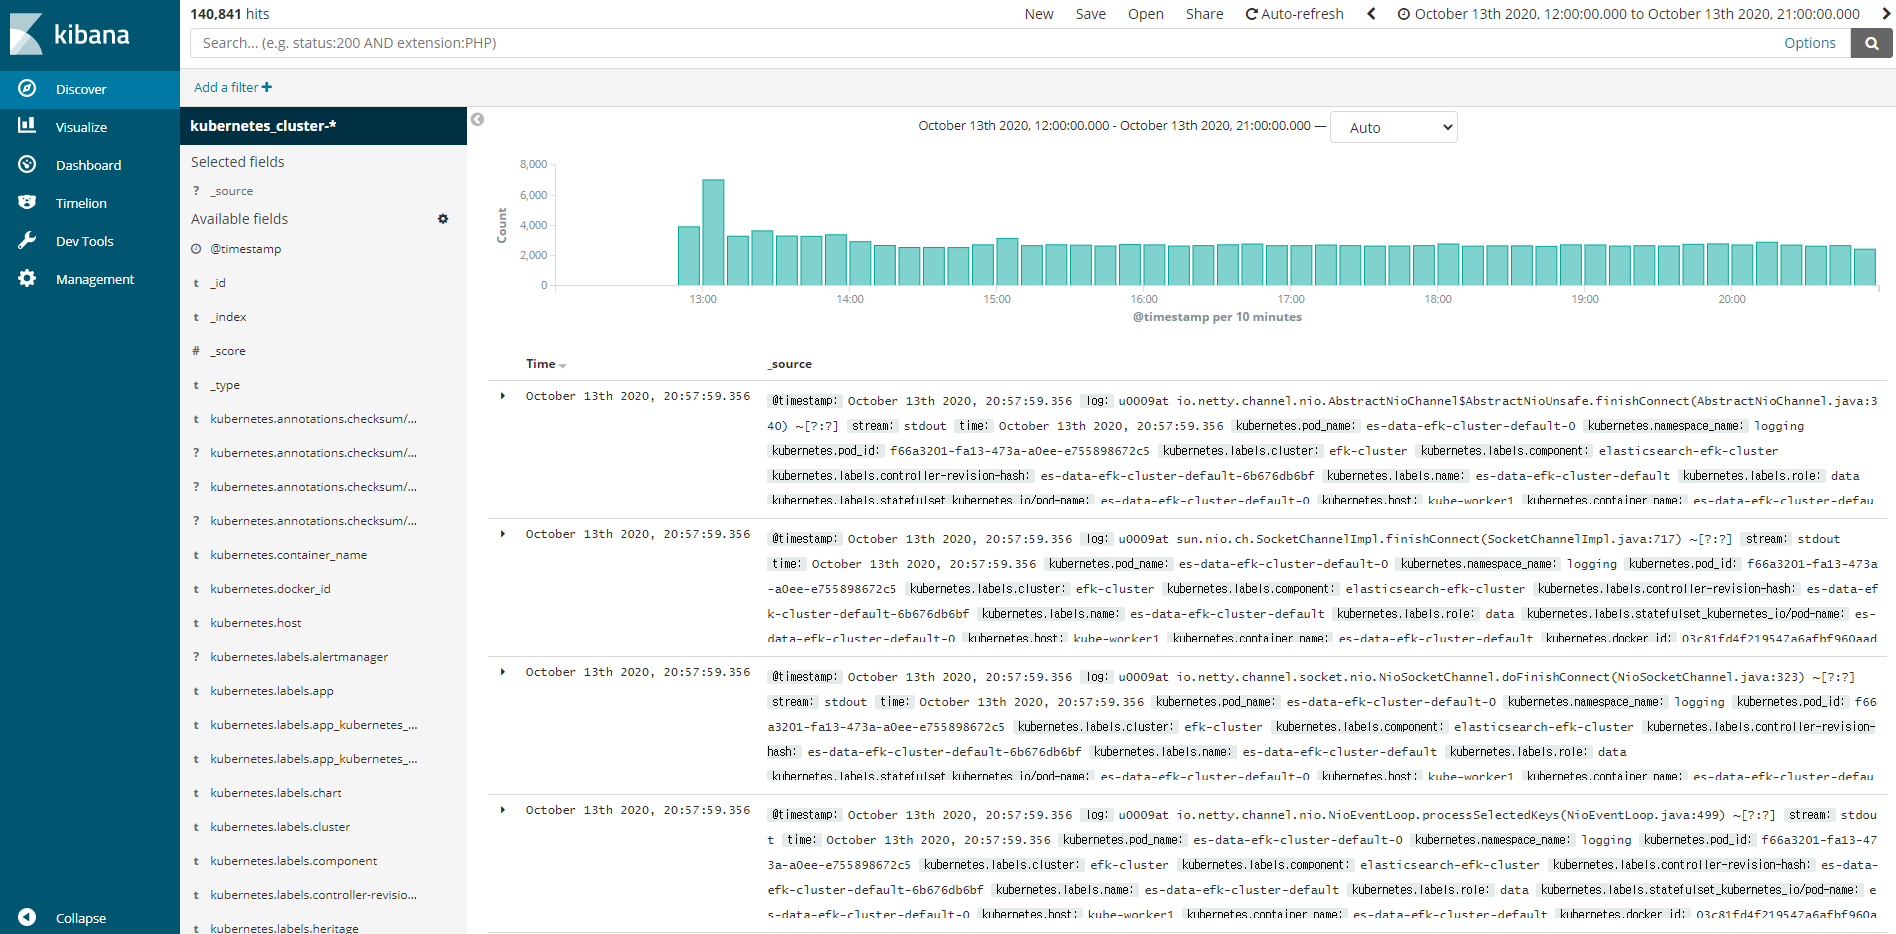 |
|---|
| [그림 3] Kibana 인덱스 패턴 확인 |
여기까지 Helm을 이용하여 쿠버네티스에 로깅 및 모니터링 시스템을 구축해보았다.
다음 포스팅에서는 Jenkins와 Slack을 연동하고 멀티 브랜치를 기반으로 작동하는 파이프라인을 생성하고 스크립트를 작성하는 부분에 대해 기술해보겠다.