

1.1. SANS DevSecOps Best Practice
2. SAST(Static Application Security Testing) 적용
2.4. PMD(Programing Mistake Detector)
SANS 연구소(SANS Institute)는 교육에서 보안 인증 정보 소스를 보유하고 있으며 사이버 및 네트워크 방어, 침투 테스트, 사고 대응, 디지털 포렌식 등 보안 교육에 있어 국제적으로 가장 높은 신뢰를 받는 보안 기관이다.
이러한 SANS 연구소에서 DevSecOps 도구들을 분류 및 정리하여 발표한 Secure DevOps Toolchain and SWAT checklist 자료를 토대로 DevSecOps 파이프라인에서 정적 분석할 도구를 선정할 것이다.
도구 선정은 앞선 포스팅을 통해 구축된 DevOps 파이프라인에 쉽게 연결할 수 있고, 자동화되어 정적 분석 및 동적 분석을 수행할 수 있는 보안 도구를 선택했다.
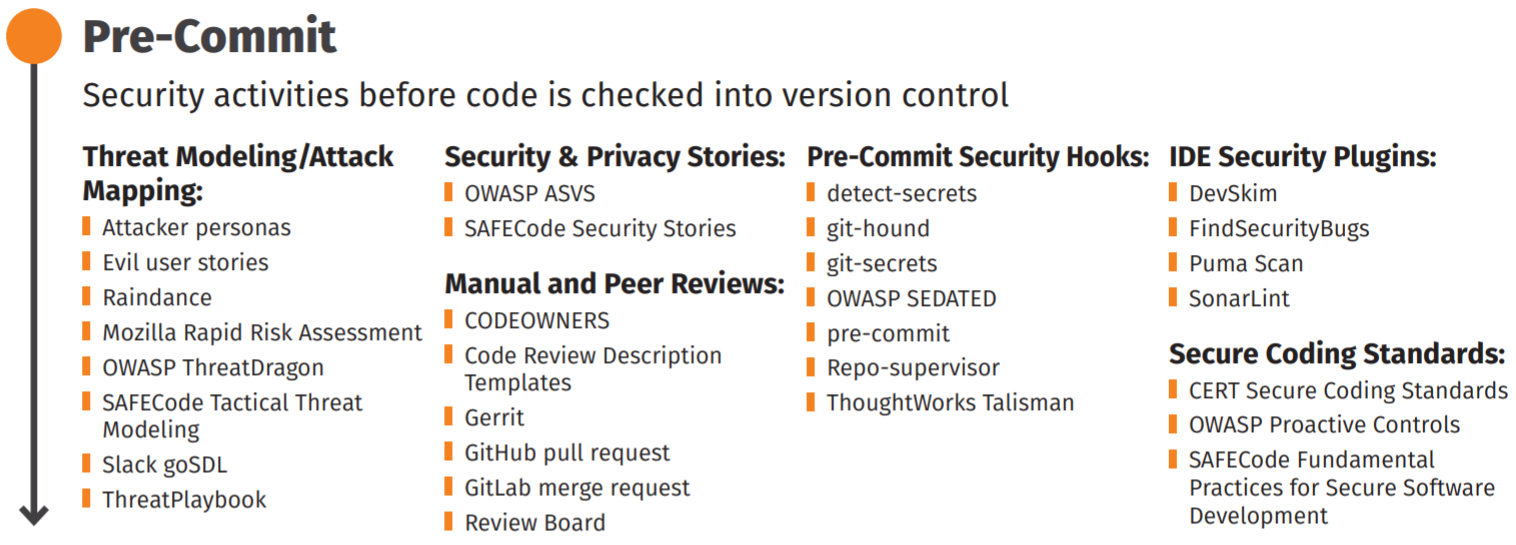
먼저 DevSecOps 파이프라인의 첫 번째 단계인 Pre-Commit 단계에서는 개발자가 코드를 GitLab과 같은 SCM에 Commit 되기 전에 완료해야하는 단계이다.
다음 [그림 1]은 SANS 연구소에서 정리한 Pre-Commit 단계에서 사용할 수 있는 보안 도구들을 정리한 것이다.
 |
|---|
| [그림 1] Pre-Commit 단계의 보안 도구 |
Pre-Commit 단계는 VSCode와 같은 IDE(Integrated Development Environment)에 보안 도구들을 플러그인으로 추가하여 개발자가 코드를 작성 및 실행하면서 보안을 검사한다.
앞선 포스팅에서 구성한 DevOps 파이프라인은 GitLab에 푸시하는 이벤트로 인해 실행되는데, Pre-Commit 단계는 푸시 이전에 수행되는 작업이기 때문에 DevSecOps 파이프라인에 추가할 도구는 없다.
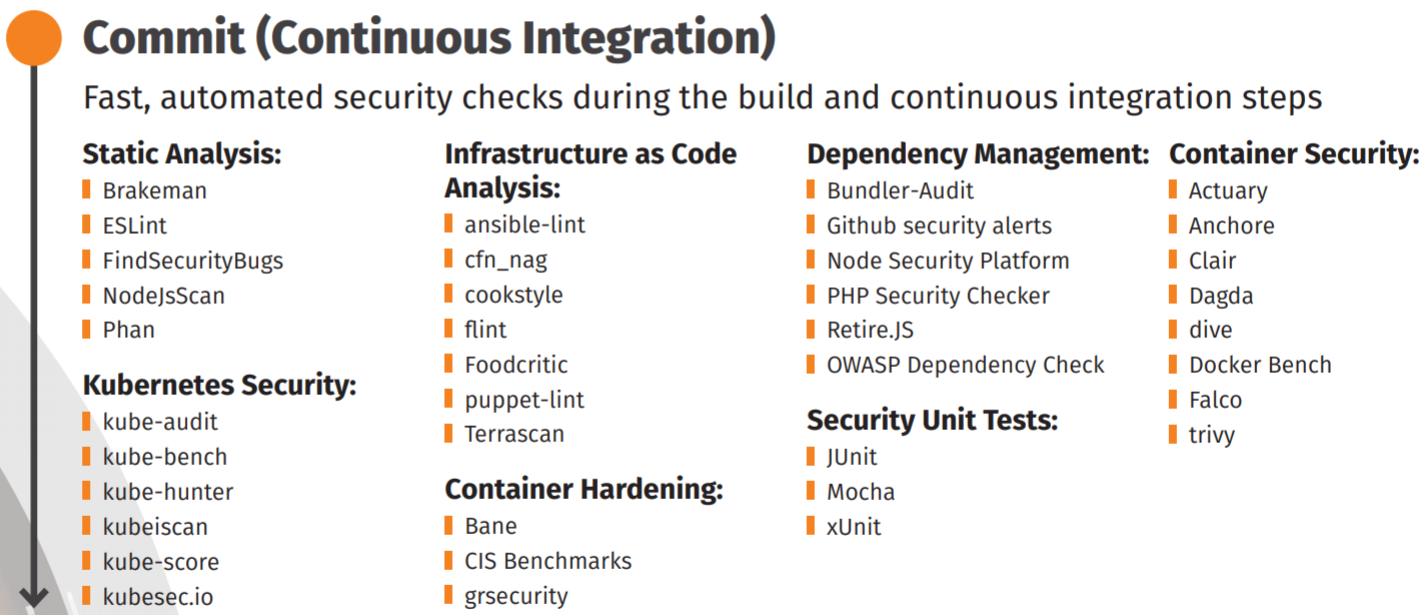
다음으로 코드를 컴파일하고 빌드하는 과정에서 정적 분석을 수행해야 하는 Commit 단계이다.
[그림 2]는 SANS 연구소에서 정리한 Commit 단계에서 사용할 수 있는 보안 도구들을 정리한 것이다.
 |
|---|
| [그림 2] Commit 단계의 보안 도구 |
Commit 단계는 빌드하고 테스트하는 과정에서 파이프라인의 보안 취약점을 찾기 위해 소스 코드 파일들을 스캔한다.
검사할 소스 코드의 언어에 따라 사용되는 도구들은 달라질 수 있다.
본 프로젝트에서는 Java 기반의 웹 서비스에 보안을 적용해볼 것이고, 정적 분석에 사용할 도구들은 다음과 같다.
OWASP Dependency Check
프로젝트의 종속성을 검사하고, 공개적으로 공개 된 취약점을 탐지하는 소프트웨어 구성 분석 도구이다.
지정된 종속성에 대한 CPE(Common Platform Enumeration) 식별자가 있는지를 확인하고, 발견되면 관련 CVE 항목에 연결되는 보고서를 생성해준다.
Jenkins와 Maven 플러그인이 존재하여 연동하기 쉽다.
SpotBugs
정적 분석 도구로 사용되는 FindBugs가 이제는 SpotBugs로 바뀌어 사용되고 있다.
관련 내용은 FindBugs README에서 확인 가능
제한된 룰 셋(Rule Set)으로 정적 분석을 수행하여 결함을 확인하고 생성된 보고서를 확인할 수 있다.
CheckStyle
코딩 스타일 규칙을 정의하여 체크해줌으로써 코딩 스타일 통일할 수 있도록 도와준다.
프로젝트 완료 후 유지보수할 떄 생겨나는 많은 문제중 하나가 많은 프로그래머들이 각자의 취향에 따라 변수명, 메소드명, 작성법등이 다르기 때문에 문제가 발생할 수 있는데 이러한 문제를 해결하기 위해 만들어졌다.
[그림 2]에 보이는 SANS 연구소의 자료에는 CheckStyle이 없지만 SpotBugs와 더불어 PMD와도 같이 정적 분석 도구로 많이 쓰이고 있어 사용해보았다.
PMD(Programing Mistake Detector)
SpotBugs와 마찬가지로 응용 프로그램에서 Java 소스를 정적 분석하여 발견된 문제를 보고해준다.
기본적으로 제공되는 룰 셋(Rule Set)이 포함되어 있으며 사용자 지정 규칙을 작성할 수도 있다.
SonarQube
SonarQube는 20개 이상의 프로그래밍 언어에서 Bugs, Code Smell, 보안 취약점을 발견할 목적으로 정적 코드 분석으로 자동 리뷰를 수행하기 위한 지속적인 코드 품질 검사용 오픈 소스 플랫폼이다.
SonarQube는 자체 분석기로 모든 규칙을 다룰 수 있다고 가정하지만 SonarQube에서 다루지 않는 Findbugs, PMD 또는 CheckStyle의 규칙이 여전히 있다.
SonarQube 자체로도 좋지만 PMD/Findbugs/Checkstyle을 별도로 사용하고 Jenkins CI에서 가시적으로 볼 수 있도록 해주는 Analysis Collector 플러그인을 사용할 수도 있다.
이것의 장점은 PMD/Findbugs/Checkstyle 구성을 SCM에 체크인하고 별도의 Sonar 서버에 의존하지 않고 Maven 빌드에 통합 할 수 있다는 것이다.
오래된 라이브러리(예: Java 8의 경우)를 수정하거나 업그레이드 혹은 대기하는 데 시간을 소비하게 되기 때문에 SonarQube는 현재 PMD, Checkstyle 및 Findbug를 폐기하고 자체 기술을 사용하여 SonarJava를 분석 및 개발하는 중이라고 함 또한 SonarLint 라는 개인 IDE 용 새 플러그인이 존재
SonarQube에는 품질 프로파일(Quality Profiles), 품질 게이트(Quality Gates)라는 정책이 존재한다.
품질 프로파일(Quality Profiles)
코드를 분석하기 위한 룰(Rule)의 집합이다.
각 언어마다 다른 품질 프로파일들이 존재한다.
품질 게이트(Quality Gates)
프로젝트 지표들로 설정된 임계 값을 정한다.
품질 게이트를 통과하기 위해서는 모든 임계값 조건을 통과해야 한다.
Anchore
Anchore는 컨테이너 이미지 스캐닝 도구이다.
컨테이너 이미지를 빌드할 때마다 알려진 보안 취약점을 스캔해서 보안적인 문제가 없는지 분석한다.
상업 버전도 존재하지만 오픈 소스 버전이 있어 손쉽게 사용이 가능하다.
Anchore는 기본적으로 보안 CVE(Common Vulnerabilities and Exposures) 목록을 기반으로 해서 스캔하고, NPM과 루비젬에 대한 보안 취약점 피드도 가져온다.
Jenkins 파이프라인에서 OWASP Dependency Check를 수행하기 위해 Jenkins 인스턴스에 OWASP Dependency Check를 설치하고 실행할 수 있는 환경을 만들어준다.
$ wget https://dl.bintray.com/jeremy-long/owasp/dependency-check-5.2.4-release.zip
$ unzip dependency-check-5.2.4-release.zip
$ mv dependency-check/ /var/lib/jenkins
dependency-check를 다운 받아 unzip하여 Jenkins의 홈디렉토리로 사용되는 /var/lib/jenkins 디렉토리로 옮겨준다.
$ /var/lib/jenkins/dependency-check/bin/dependency-check.sh --scan `pwd` --format HTML --out /var/lib/jenkins/reports/dependency-check-report --prettyPrint
스캔할 소스 코드가 들어있는 프로젝트 디렉토리에서 실행 dependency-check를 실행한다.
–scan 옵션에 pwd 명령을 통해 얻은 프로젝트 디렉토리가 들어가야하며, –out 옵션의 값에 해당하는 디렉토리인 /var/lib/jenkins/reports/dependency-check-report애 스캔하여 출력되는 보고서 파일이 저장된다.
–format 옵션에 들어가는 값은 HTML, XML, JSON이 존재하는데, 여기서는 dependecy-chcek 결과를 SonarQube에서도 확인할 수 있도록 HTML 파일로 보고서가 생성되도록 했다.
참고: 스캔 중에 odc.mv.db 관련 에러가 발생한 적이 있는데, $ /var/lib/jenkins/dependency-check/bin/dependency-check.sh –purge 명령을 통해 해결됨
Maven에서는 pom.xml 이라는 빌드 파일을 사용하여 빌드 정보를 기술한다.
pom.xml 파일에 SpotBugs를 사용하도록 명시하여 프로젝트를 빌드할 때 SpotBugs를 통해 정적 분석을 진행할 수 있도록 한다.
<plugin>
    <groupId>com.github.spotbugs</groupId>
    <artifactId>spotbugs-maven-plugin</artifactId>
    <version>3.1.12.2</version>
    <configuration>
        <effort>Max</effort>
        <threshold>Low</threshold>
        <failOnError>true</failOnError>
        <plugins>
            <plugin>
                <groupId>com.h3xstream.findsecbugs</groupId>
                <artifactId>findsecbugs-plugin</artifactId>
                <version>1.10.1</version>
            </plugin>
        </plugins>
    </configuration>
    <executions>
        <execution>
            <id>scan</id>
            <phase>verify</phase>
            <goals>
                <goal>check</goal>
            </goals>
        </execution>
    </executions>
</plugin>
SpotBugs와 마찬가지로 pom.xml 파일에 CheckStyle을 사용하도록 명시하여 프로젝트를 빌드할 때 CheckStyle을 통해 정적 분석을 진행할 수 있도록 한다.
<plugin>
    <groupId>org.apache.maven.plugins</groupId>
    <artifactId>maven-checkstyle-plugin</artifactId>
    <version>2.17</version>
    <executions>
        <execution>
            <id>validate</id>
            <phase>validate</phase>
            <configuration>
                <configLocation>google_checks.xml</configLocation>
                <suppressionsLocation>suppressions.xml
                </suppressionsLocation>
                <encoding>UTF-8</encoding>
                <failsOnError>true</failsOnError>
                <consoleOutput>true</consoleOutput>
                <includeTestSourceDirectory>true
                </includeTestSourceDirectory>
            </configuration>
            <goals>
                <goal>check</goal>
            </goals>
        </execution>
    </executions>
</plugin>
OMD 또한 pom.xml 파일에 PMD를 사용하도록 명시하여 프로젝트를 빌드할 때 PMD를 통해 정적 분석을 진행할 수 있도록 한다.
<plugin>
    <groupId>org.apache.maven.plugins</groupId>
    <artifactId>maven-pmd-plugin</artifactId>
    <version>3.13.0</version>
    <executions>
        <execution>
            <id>pmd-scan</id>
            <phase>verify</phase>
            <goals>
                <goal>check</goal>
            </goals>
        </execution>
    </executions>
</plugin>
SonarQube를 사용하기 위해서 여러 가지 방법으로 설치할 수 있지만 본 프로젝트에서는 Docker를 통해서 설치하는 방법을 설명할 것이다.
$ docker run --restart=always -d -p 9000:9000 -p 9092:9092 --name sonarqube sonarqube
Jenkins 인스턴스에서 Docker 명령을 통해 sonarqube 공식 이미지를 다운로드하여 9000번 포트를 사용하도록 설정한다.
$ vim /usr/local/maven/conf/settings.xml
<settings>
    <pluginGroups>
        <pluginGroup>org.sonarsource.scanner.maven</pluginGroup>
    </pluginGroups>
    <profiles>
        <profile>
            <id>sonar</id>
            <activation>
                <activeByDefault>true</activeByDefault>
            </activation>
            <properties>
                <!-- Optional URL to server. Default value is http://localhost:9000 -->
                <sonar.host.url>
                http://JENKINS_SERVER_IP:9000
                </sonar.host.url>
            </properties>
        </profile>
    </profiles>
</settings>

$ mvn clean verify sonar:sonar
그리고 위와 같이 maven 설정 파일에서 SonarQube 플러그인에 대해 설정하고 mvn clean verify 명령을 통해 빌드할 때 SonarQube가 정상적으로 동작하는지 확인해본다.
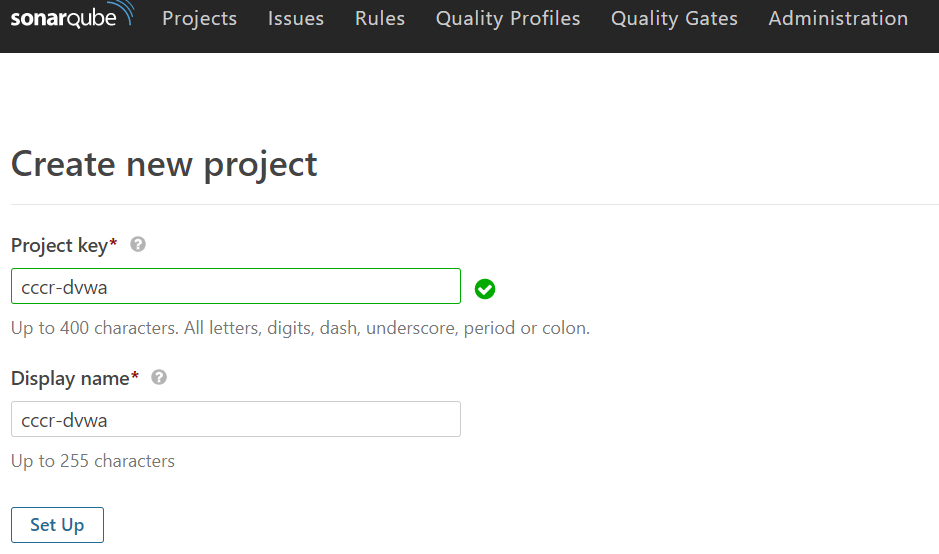
정상적으로 SonarQube가 실행되면 Create New Project 버튼을 누르면 다음 [그림 3]과 같은 화면이 나온다.
 |
|---|
| [그림 3] SonarQube 프로젝트 생성 |
Project key와 Display name을 입력한 후 Set Up 버튼을 눌러 프로젝트를 생성한다.
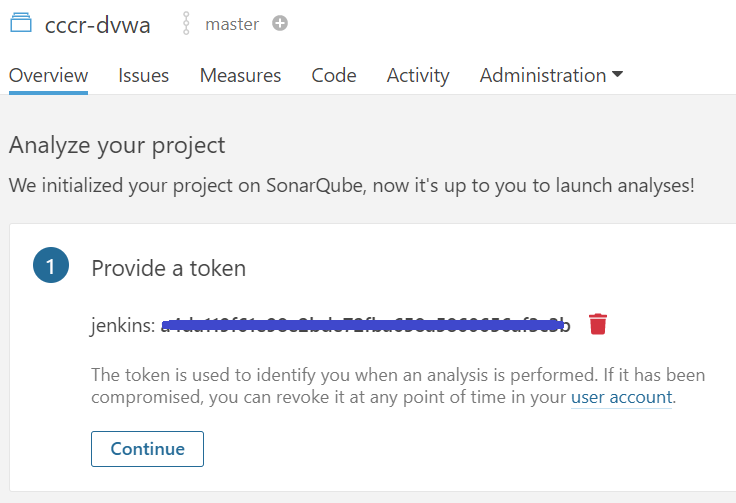
프로젝트가 정상적으로 생성되었다면 토큰을 생성한다.
Provide a token에 임의의 키를 입력한 후에 Generate를 클릭하면 다음 [그림 4]와 같이 토큰 키가 생성된다.
 |
|---|
| [그림 4] SonarQube 프로젝트의 토큰 생성 |
생성된 토큰은 Jenkins와 SonarQube를 연동하여 파이프라인에서 활용하기 위해 사용된다.
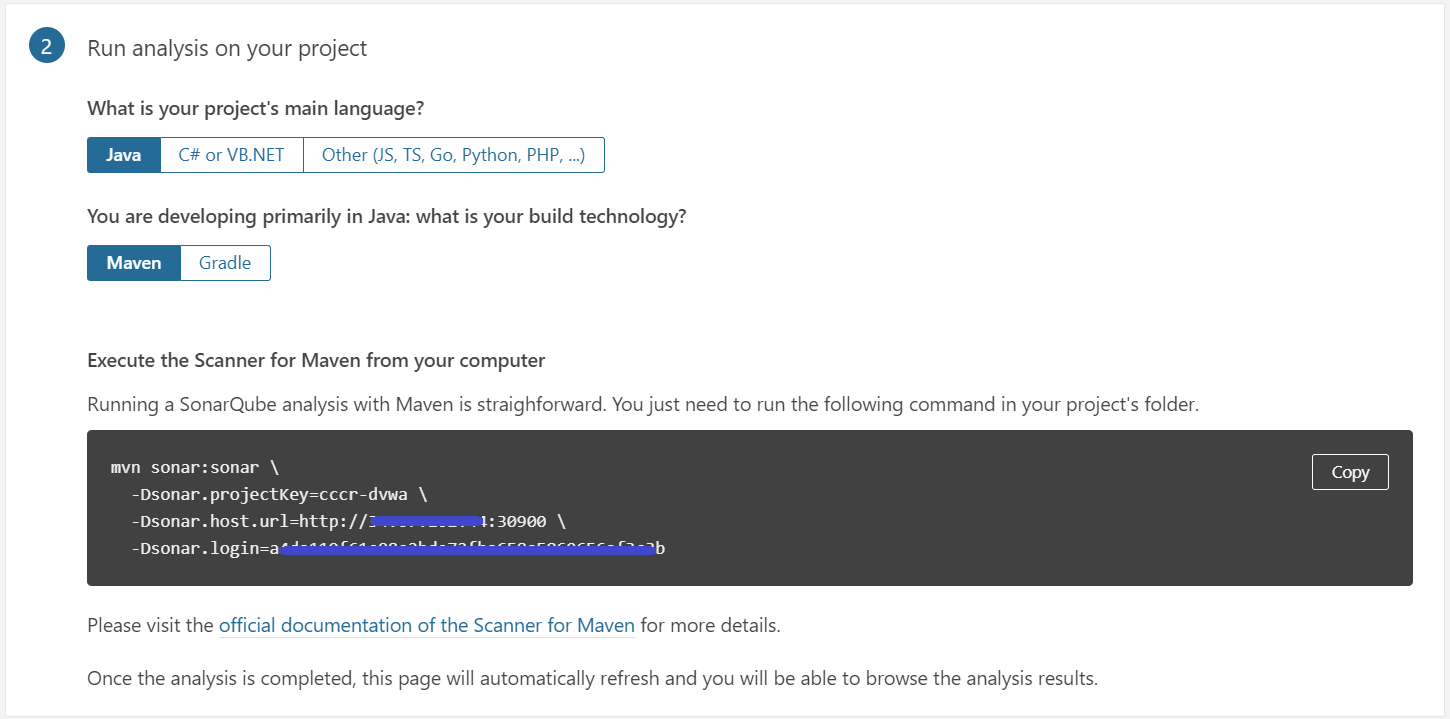
아래에는 다음 [그림 5]와 같이 Run analysis on your project 항목이 있는데, 해당 프로젝트에서 분석할 애플리케이션의 언어와 빌드 도구를 선택하면 SonarQube 분석을 실행시킬 수 있는 명령어가 나온다.
 |
|---|
| [그림 5] SonarQube 프로젝트 설정 및 실행 방법 |
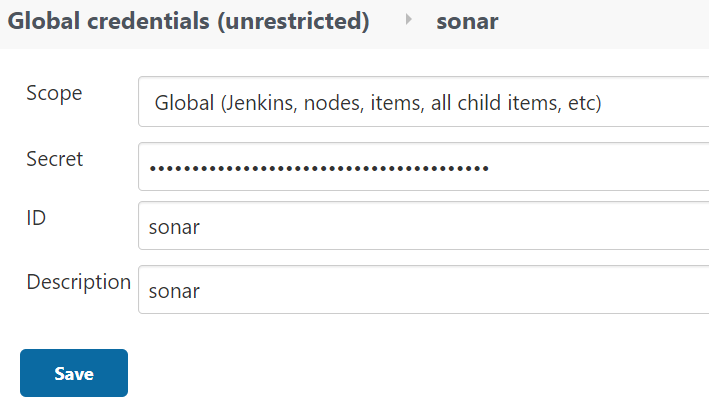
다음으로 [그림 6]과 같이 Jenkins에서 SonarQube credentials을 생성한다.
 |
|---|
| [그림 6] Jenkins에서 SonarQube credentials 생성 |
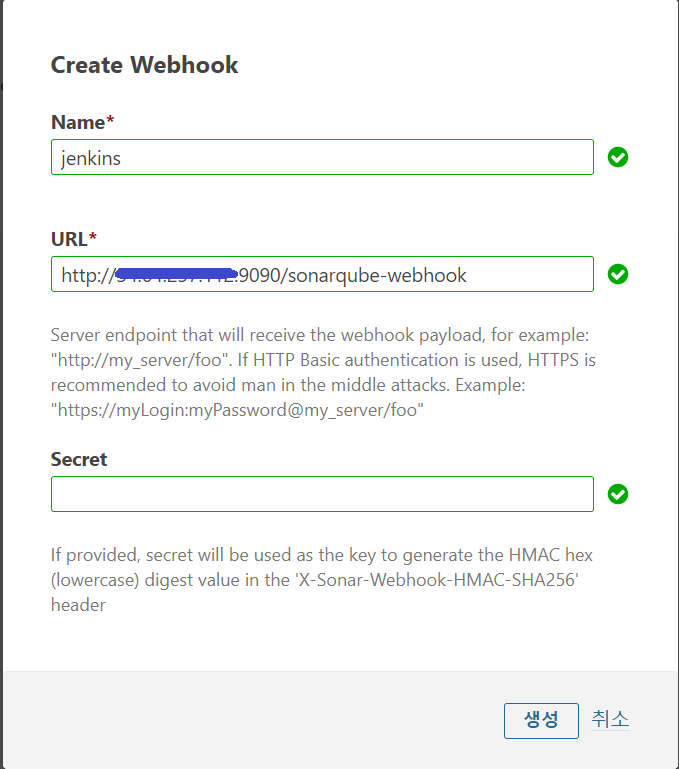
그리고 다음 [그림 7]과 같이 Jenkins와 연동하기 위해 SonarQube에서 웹훅을 생성하고 설정한다.
 |
|---|
| [그림 7] SonarQube 웹훅 생성 |
이렇게 설정된 웹훅은 Jenkins에서 요청이 오면 정적 분석에 대한 결과를 Jenkins QualifyGate에 응답하게 된다.
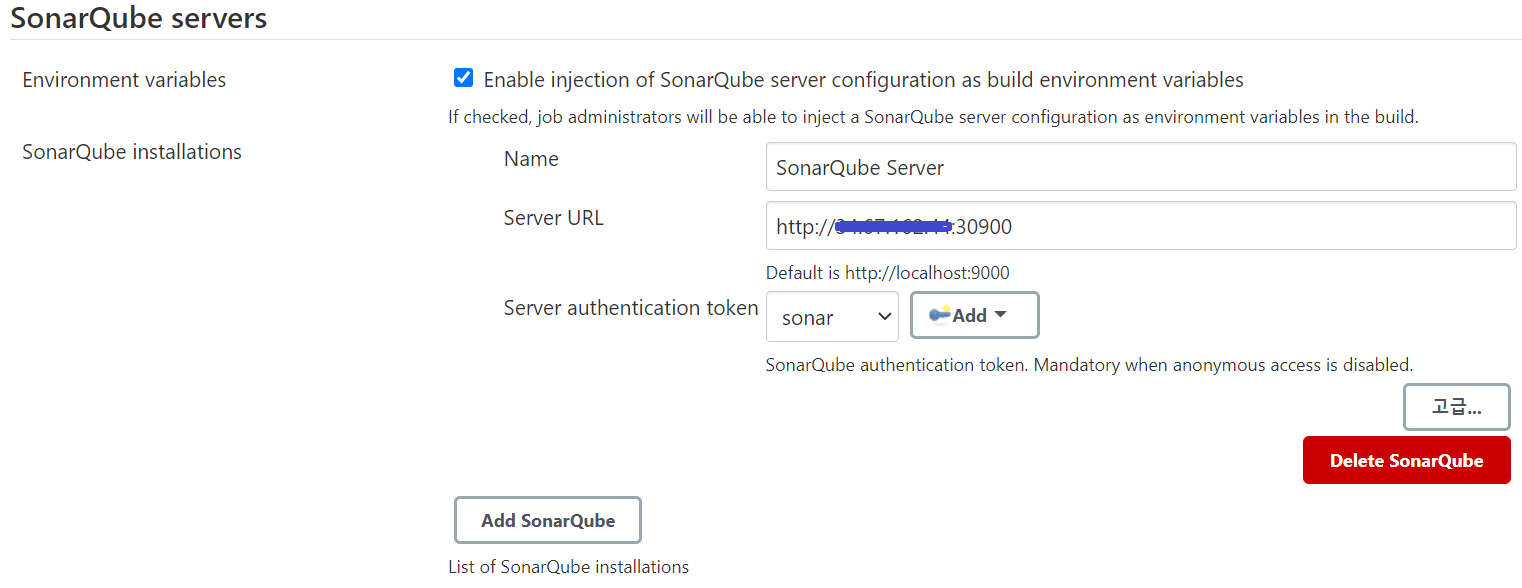
다음으로 [그림 8]과 같이 Jenkins에서 SonarQube 서버를 연동하기 위한 설정을 진행한다.
Jenkins 관리 > 시스템 설정에서 SonarQube Servers가 없으면 Sonar Quality Gates 플러그인을 설치해야 함
 |
|---|
| [그림 8] Jenkins에서 SonarQube 서버 설정 |
[그림 6]에서 생성했었던 Token을 선택하고 SonarQube Server URL을 설정한다.
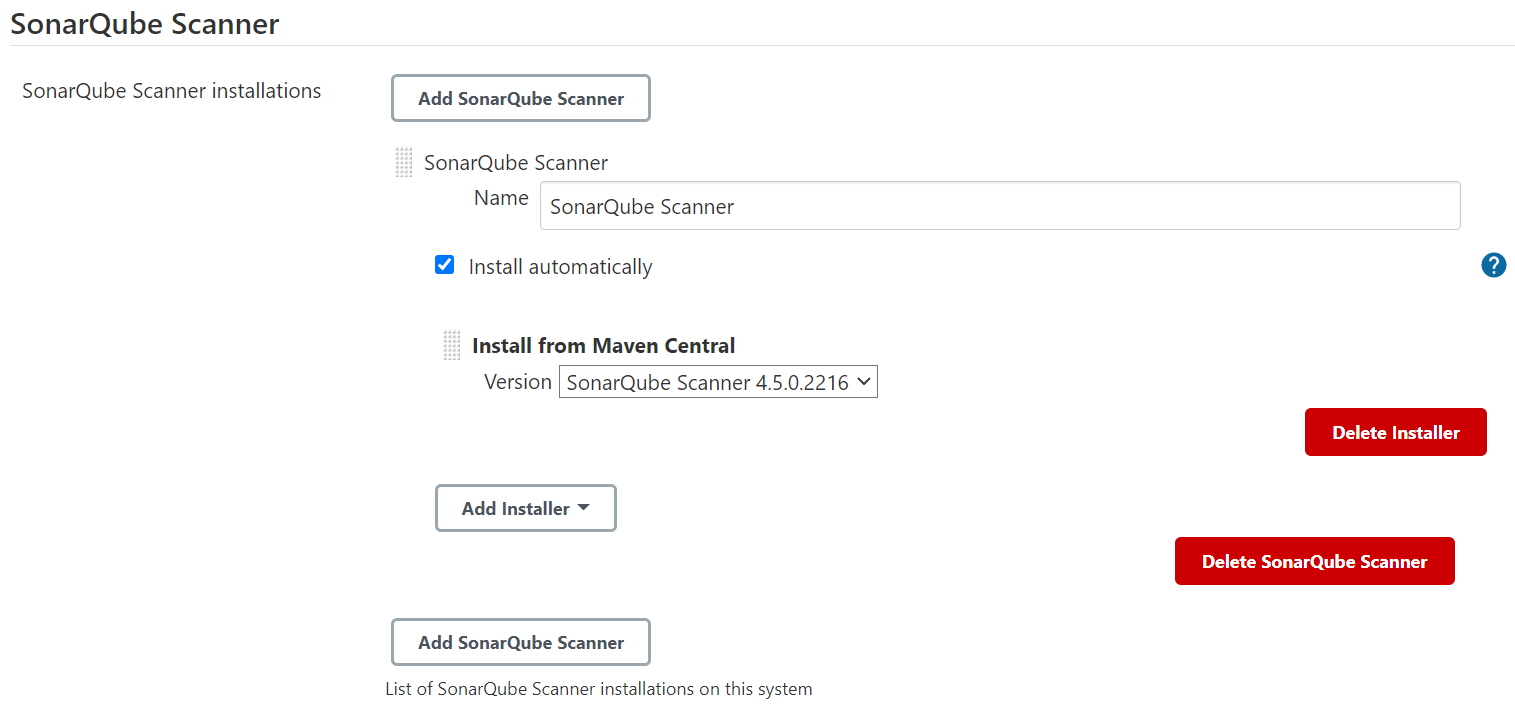
그리고 Jenkins 관리 > Global Tool Configuration에서 SonarQube Scanner에서 다음 [그림 9]와 같이 구성한다.
Install automatically를 체크하면 SonarQube Scanner가 자동으로 설치하도록 구성
 |
|---|
| [그림 9] Jenkins에서 SonarQube 스캐너 설정 |
여기까지 정상적으로 설정되었다면 Jenkins Pipeline에 SonarQube를 활용할 수 있는 환경이 모두 갖춰진 것이다.
추가적으로 Jenkins에서 SonarQube로 분석한 결과 파일을 가져올 수 있도록 CheckStyle, PMD, SpotBugs와 Dependency-Check 각각의 분석 결과 파일의 경로를 설정해보겠다.
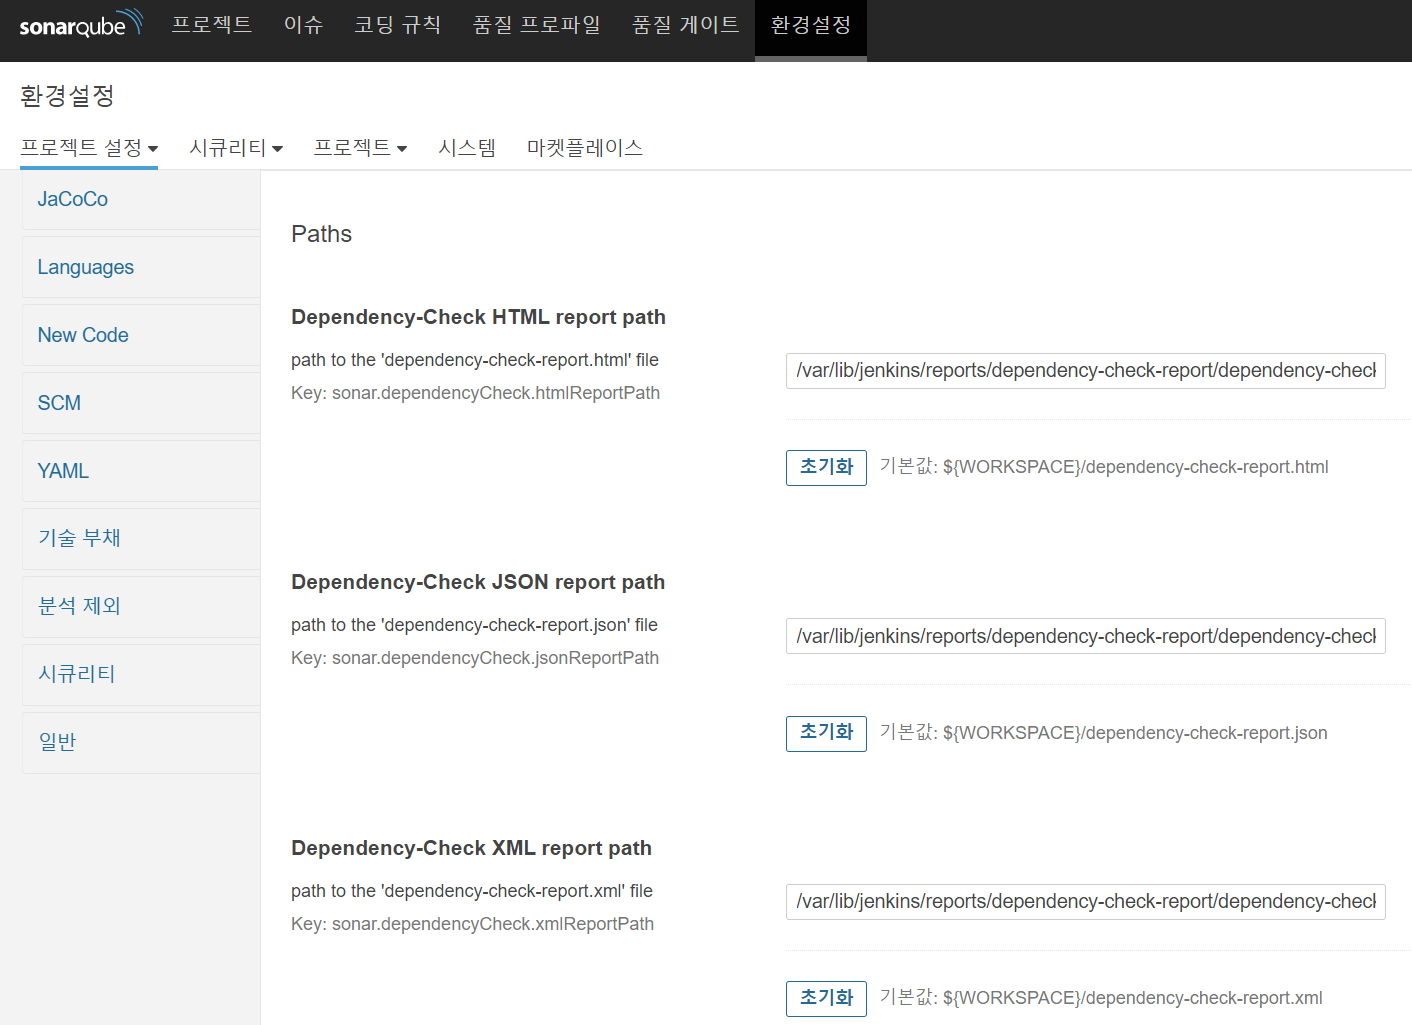
먼저 Dependency-Check는 환경설정 > 프로젝트 설정 > Dependency-Check 탭에 들어가서 설정한다.
 |
|---|
| [그림 10] SonarQube에서 Dependency-Check 설정 |
Dependency-Check는 HTML, JSON, XML 세 가지 파일 형식으로 결과를 도출할 수 있는데, 각 파일에 대한 저장하고 싶은 Path를 입력하면 된다.
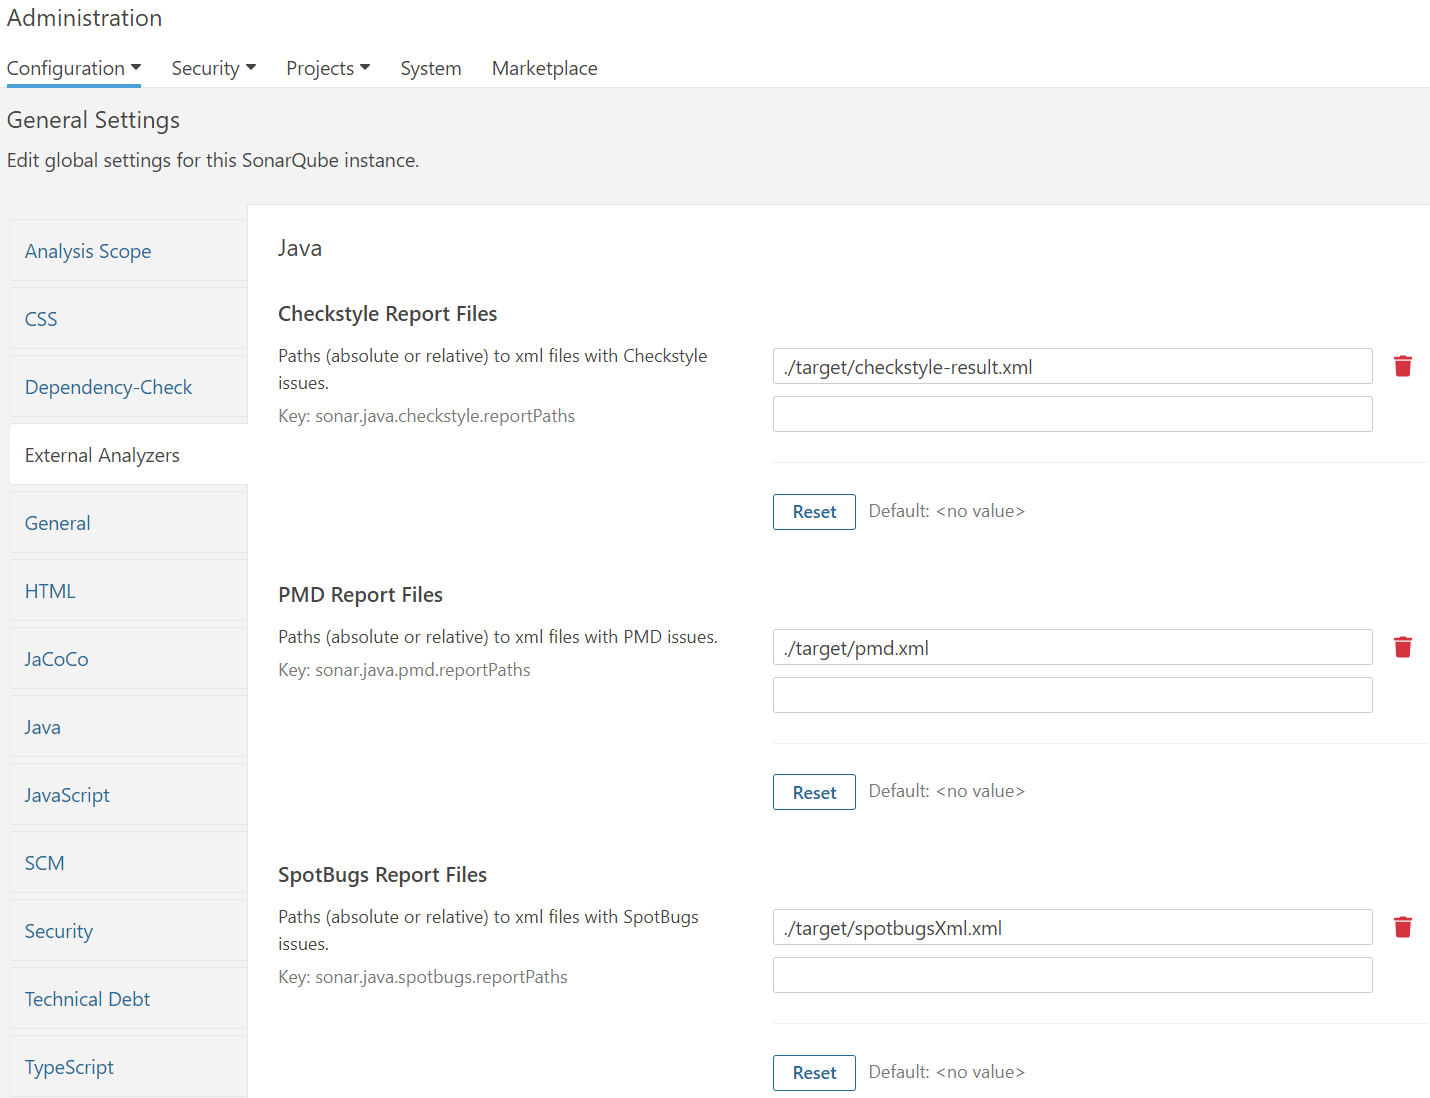
다음으로 CheckStyle, PMD, SpotBug는 Dependency-Check 탭 바로 아래의 External Analyzers 탭에서 설정한다.
 |
|---|
| [그림 11] SonarQube에서 External Analyzers 설정 |
CheckStyle, PMD, SpotBug도 마찬가지로 각 툴에서 도출된 결과 레포트 파일을 어느 경로에 저장할 것인지를 명시해준다.
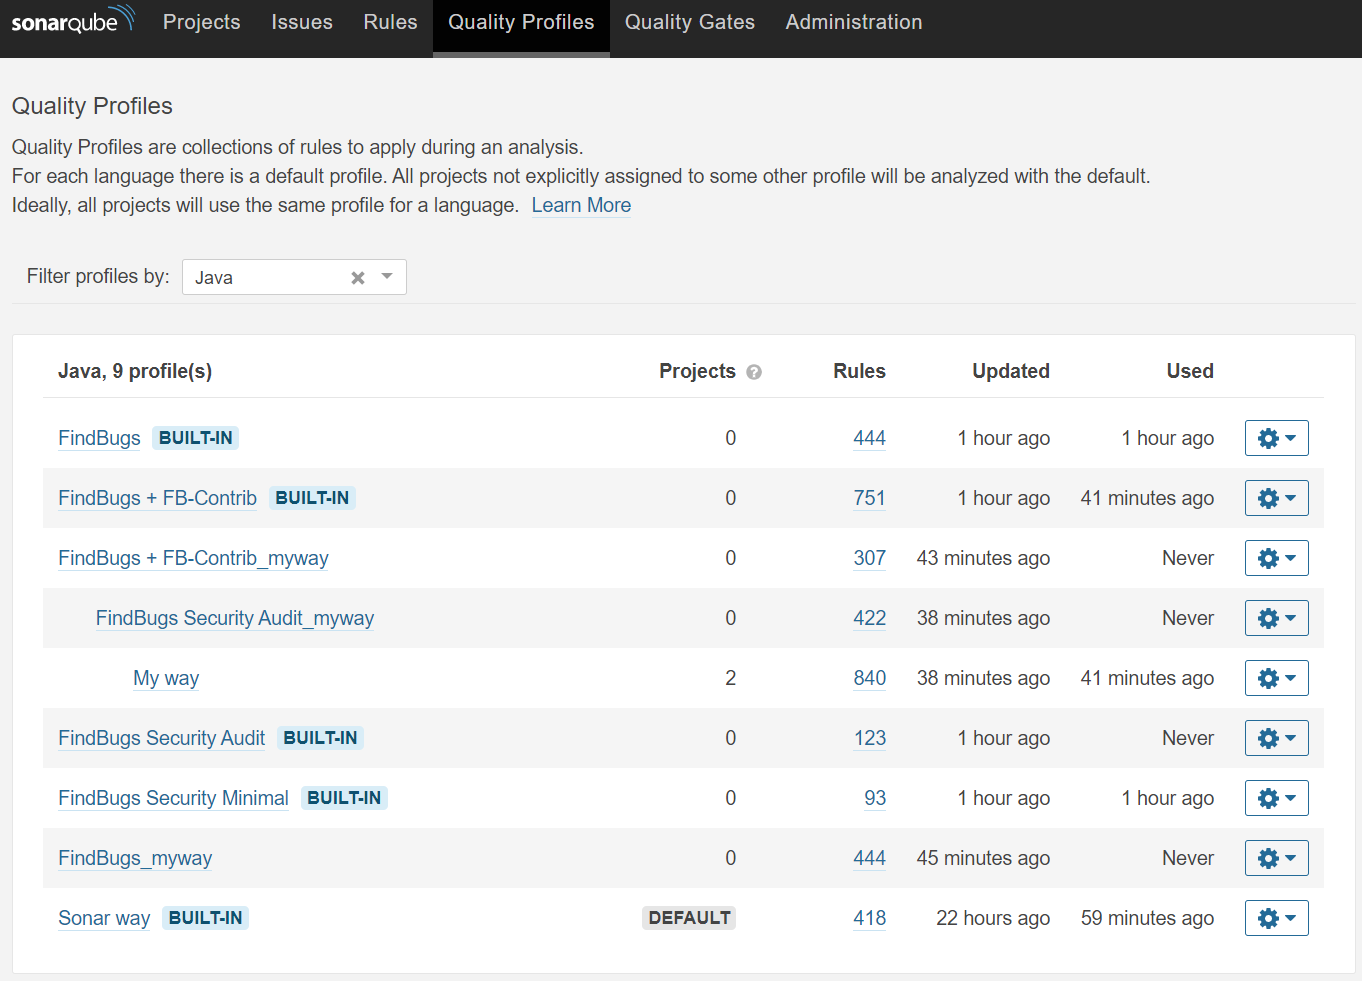
각 툴에 대한 경로 설정이 정상적으로 끝났다면 Quality Profiles를 설정해보자.
 |
|---|
| [그림 12] SonarQube 품질 프로파일 구성 |
Quality Profiles은 SonarQube에서 분석할 때 적용할 Rule을 설정할 수 있다.
기본적으로는 DEFAULT라고 되어있는 Sonar way Profile로 분석을 하지만, BUILT-IN 되어 있는 Rule을 모두 분석해보기 위해 My way라는 Profile을 만들어 하위 Profile로 다른 Profile을 배치(?)한 후에 My way Profile의 오른쪽 톱니바퀴를 눌러 Set as Default를 설정해주었다.
젠장.. Jenkins에 SonarQube 연동하여 Pipeline 실행시킨 스크린샷이 어디갔지 -_-;
다음 Jenkins에 연동핳 정적 분석 도구인 Anchore를 살펴보겠다.
Anchore는 컨테이너 이미지의 검사, 분석 및 인증을 위한 중앙 집중식 서비스를 제공하는 오픈 소스 프로젝트이다.
GEM, Java Archive (jar, war, ear), NPM, Python 패키지가 제공되며, 특히 Jenkins 플러그인을 통해 연동이 가능하다.
우선 Kubernetes 및 Helm을 활용하여 Anchore 서버를 구성해보자.
crisis51526@cloudshell:~ (cccr-nov2)$ kubectl create namespace anchore
nameanchore created

crisis51526@cloudshell:~ (cccr-nov2)$ helm repo add anchore https://charts.anchore.io
"anchore" has been added to your repositories
crisis51526@cloudshell:~ (cccr-nov2)$ helm install anchore anchore/anchore-engine -n anchore
NAME: anchore
LAST DEPLOYED: Sat Oct 20 18:06:18 2020
NAMESPACE: anchore
STATUS: deployed
REVISION: 1
TEST SUITE: None
NOTES:
To use Anchore Engine you need the URL, username, and password to access the API.

Anchore Engine can be accessed via port 8228 on the following DNS name from within the cluster:
anchore-anchore-engine-api.anchore.svc.cluster.local

Here are the steps to configure the anchore-cli (`pip install anchorecli`). Use these same values for direct API access as well.

To configure your anchore-cli run:

    ANCHORE_CLI_USER=admin
    ANCHORE_CLI_PASS=$(kubectl get secret --namespace anchore anchore-anchore-engine -o jsonpath="{.data.ANCHORE_ADMIN_PASSWORD}" | base64 --decode; echo)

Using the service endpoint from within the cluster you can use:
    ANCHORE_CLI_URL=http://anchore-anchore-engine-api.anchore.svc.cluster.local:8228/v1/


To verify the service is up and running, you can run container for the Anchore Engine CLI:

    kubectl run -i --tty anchore-cli --restart=Always --image anchore/engine-cli  --env ANCHORE_CLI_USER=admin --env ANCHORE_CLI_PASS=${ANCHORE_CLI_PASS} --env ANCHORE_CLI_URL=http://anchore-anchore-engine-api.anchore.svc.cluster.local:8228/v1/

from within the container you can use 'anchore-cli' commands.

* NOTE: On first startup of anchore-engine, it performs a CVE data sync which may take several minutes to complete. During this time the system status will report 'partially_down' and any images added for analysis will stay in the 'not_analyzed' state.
Once the sync is complete, any queued images will be analyzed and the system status will change to 'all_up'.

Initial setup time can be >120sec for postgresql setup and readiness checks to pass for the services as indicated by pod state. You can check with:
    kubectl get pods -l app=anchore-anchore-engine,component=api

A quick primer on using the Anchore Engine CLI follows. For more info see: https://github.com/anchore/anchore-engine/wiki/Getting-Started

View system status:

    anchore-cli system status

Add an image to be analyzed:

    anchore-cli image add <imageref>

List images and see the analysis status (not_analyzed initially):

    anchore-cli image list

Once the image is analyzed you'll see status change to 'analyzed'. This may take some time on first execution with a new database because
the system must first do a CVE data sync which can take several minutes. Once complete, the image will transition to 'analyzing' state.

When the image reaches 'analyzed' state, you can view policy evaluation output with:

    anchore-cli evaluate check <imageref>

List CVEs found in the image with:

    anchore-cli image vuln <imageref> os

List OS packages found in the image with:
    anchore-cli image content <imageref> os

List files found in the image with:
    anchore-cli image content <imageref> files
Anchore Engine이 정상적으로 배포되었다면 pip를 통해 anchore-cli 패키지를 설치하고, anchore 컨테이너에 전달 된 secret에 액세스하여 kubernetes에서 비밀번호를 검색한다.
$ yum install -y epel-release
$ yum install -y python-pip
$ pip install anchorecli
$ export ANCHORE_CLI_USER=admin
$ export ANCHORE_CLI_PASS=foobar
$ export ANCHORE_CLI_URL=http://ANCHORE_IP:30228/v1

crisis51526@cloudshell:~/anchore-engine (cccr-nov2)$ export ANCHORE_CLI_PASS=$(kubectl get secret --namespace anchore anchore-anchore-engine -o jsonpath="{.data.ANCHORE_ADMIN_PASSWORD}" | base64 --decode; echo)
crisis51526@cloudshell:~/anchore-engine (cccr-nov2)$ echo $ANCHORE_CLI_PASS
foobar
다음으로 Jenkins Pipeline에서 실행해보기 전에 anchore-cli 명령을 통해 앞서 컨테이너 이미지 검사가 정상적으로 이루어지는지 테스트 해보겠다.
crisis51526@cloudshell:~/anchore-engine (cccr-nov2)$ vim anchore-nodeport.yaml
apiVersion: v1
kind: Service
metadata:
name: anchore-api
spec:
type: NodePort
selector:
    app: anchore-anchore-engine
    component: api
ports:
    - protocol: TCP
    port: 8228
    targetPort: 8228
    nodePort: 30228

crisis51526@cloudshell:~/anchore-engine (cccr-nov2)$ kubectl create -f anchore-nodeport.yaml -n anchore
service/anchore-api created

[root@jenkins cccr-dvwa]# anchore-cli image add jisunpark/cccr-dvwa-java-web --dockerfile=Dockerfile --force
Image Digest: sha256:fec038ff428898223fc9fb516caedbf52c4572f2e491590d8f5647e8e5d787c9
Parent Digest: sha256:fec038ff428898223fc9fb516caedbf52c4572f2e491590d8f5647e8e5d787c9
Analysis Status: not_analyzed
Image Type: docker
Analyzed At: 2020-10-20T18:43:29Z
Image ID: 85a4a0ea97867479bcb328c7a6c75691434d36ea0a0b75e6e453b22ff0f6fc7d
Dockerfile Mode: Actual
Distro: debian
Distro Version: 10
Size: 920176640
Architecture: amd64
Layer Count: 16

Full Tag: docker.io/jisunpark/cccr-dvwa-java-web:latest
Tag Detected At: 2020-10-20T18:40:33Z
jisunpark/cccr-dvwa-java-web라는 테스트용 이미지는 DVJA(Damn Vulnerable Java Application)를 사용했다.
DVWA(Damn Vulnerable Web Application)는 취약점이 많은 웹 애플리케이션을 모의해킹 및 실습 용도로 PHP와 MySQL을 사용하여 만들어진 것이고, DVJA는 Java로 만들어진 웹 애플리케이션이다.
https://github.com/appsecco/dvja
위의 git을 클론하여 DVJA 도커 이미지를 helm으로 배포할 수 있도록 개발하여 실습을 진행했다.
최종적으로 정적 분석 도구들을 Jenkins에 연동하여 Pipeline 코드를 작성한 내용은 다음과 같다.
properties([
    parameters([
        string(name: 'sonar.projectKey', defaultValue: 'cccr-dvwa'),
        string(name: 'sonar.host.url', defaultValue: 'http://JENKINS_SERVER_IP:9000'),
        string(name: 'sonar.login', defaultValue: '265c24760ec4f5cf1f28b87981c7bbe55c3bdffc'),
    ])
])
pipeline {
    environment {
        SLACK_CHANNEL = '#send-slack-message-from-jenkins'
        REGISTRY = 'crisis513/cccr-dvwa-java-web'
        REGISTRYCREDENTIAL = 'dockerhub'
        DOCKER_IMAGE = ''
    }
    agent any
    tools {
        maven 'mvn'
    }
    stages {
        stage('Git clone') {
            steps {
                git 'https://github.com/JisunParkRea/cccr-dvwa.git'
            }
        }
        stage('Docker image build and push to Dockerhub') {
            steps{
                script {
                    DOCKER_IMAGE = docker.build registry
                    docker.withRegistry('', REGISTRYCREDENTIAL) {
                        DOCKER_IMAGE.push("latest")
                    }
                }
            }
        }
        stage('Anchore Analysis') {
            steps {
                sh 'echo "$REGISTRY:latest `pwd`/Dockerfile" > anchore_images'
                anchore name: 'anchore_images'
            }
        }
        stage('Clean local docker image') {
            agent any
                steps {
                sh 'docker rmi $REGISTRY:latest'
            }
        }
        stage ('Static Analysis(PMD, SpotBugs, CheckStyle)') {
            steps {
                sh 'mvn pmd:pmd spotbugs:spotbugs checkstyle:checkstyle'
            }
        }
        stage ('Dependency-Check Analysis') {
            steps {
                sh '/var/lib/jenkins/dependency-check/bin/dependency-check.sh --scan `pwd` --format HTML --out /var/lib/jenkins/reports/dependency-check-report --prettyPrint'
            }
        }
        stage('Sonarqube and Quality gate') {
            options {
                timeout(time: 5, unit: 'MINUTES')
                retry(2)
            }
            steps {
                withSonarQubeEnv('SonarQube Server') {
                    sh "mvn sonar:sonar"
                }
                script {
                    qualitygate = waitForQualityGate()
                    if (qualitygate.status != "OK") {
                        currentBuild.result = "FAILURE"
                        slackSend (channel: $SLACK_CHANNEL, color: '#F01717', message: "*$JOB_NAME*, <$BUILD_URL|Build #$BUILD_NUMBER>")
                    }
                }
            }
        }
    }
    post {
        success {
            slackSend (channel: $SLACK_CHANNEL, color: '#00FF00', message: "SUCCESSFUL: Job '${env.JOB_NAME} [${env.BUILD_NUMBER}]' (${env.BUILD_URL})")
        }
        failure {
            slackSend (channel: $SLACK_CHANNEL, color: '#F01717', message: "FAILURE: '${env.JOB_NAME} [${env.BUILD_NUMBER}]' (${env.BUILD_URL})")
        }
    }
}
일련의 과정을 정리하면 다음과 같다.
코드를 Git에 Push하면 Jenkins에서 웹훅을 받아 파이프라인이 자동으로 실행
웹훅을 받은 Git 레포지토리를 Clone
해당 Git에 업데이트된 코드를 기반으로 Docker 이미지를 빌드하고 지정된 Docker hub로 Push
빌드된 이미지를 Anchore로 분석
도커 이미지를 제거 후 SpotBugs, PMD, CheckStyle, Dependency-Check 도구를 통해 코드 정적 분석
그리고 SonarQube에서 설정한 Quality Profiles의 Rule을 바탕으로 정적 분석
해당 파이프라인의 성공 여부를 Slack 메시지로 전달
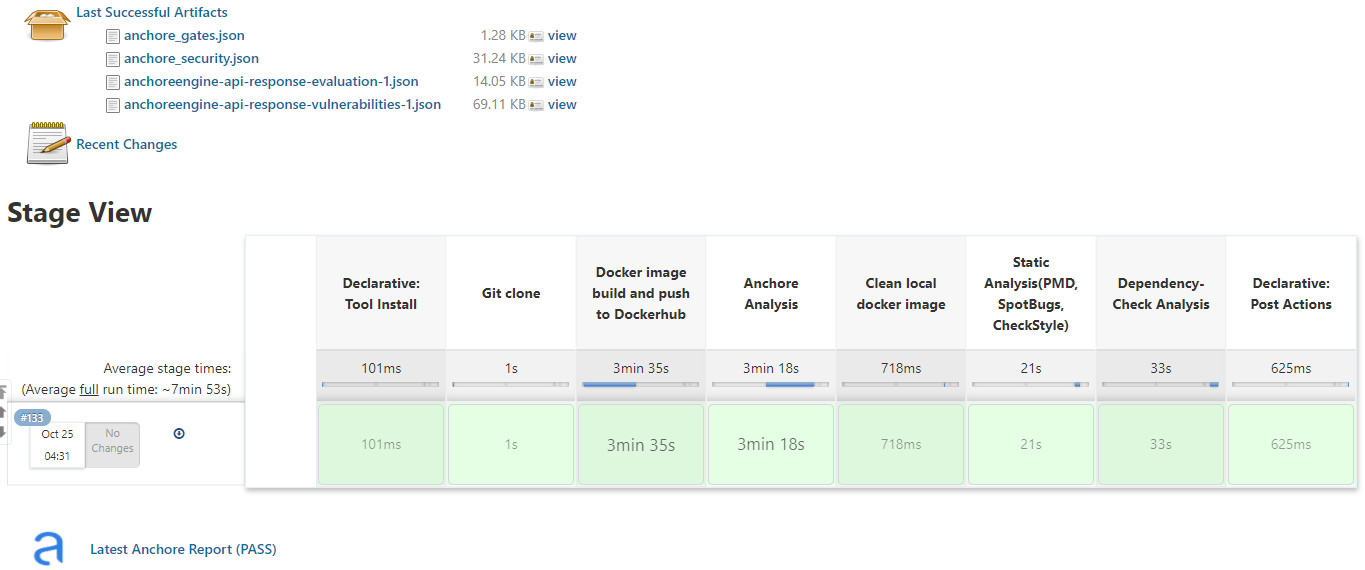
해당 파이프라인을 실행시키면 다음 [그림 13]과 같이 정상적으로 파이프라인이 실행된 것을 확인할 수 있다.
 |
|---|
| [그림 13] Jenkins 정적 분석도구 파이프라인 테스트 |
왜 [그림 13]에 SonarQube stage는 없는 것인가… 분명 성공했었는데 스샷을 못남긴 듯 하다 ㅠㅠㅠ
아무튼 여기까지 DevOps 파이프라인에서 배포할 때 정적 테스트를 거쳐 배포할 수 있는 방법을 알아보았다.
Acceptance, Production 단계인 CD 파이프라인에 OWASP ZAP, Hashicorp Vault, kube-monkey 등 동적 테스트 자동화도 적용시켜보고 싶었지만 갑작스럽게 군대를 가게되어 필자는 여기까지만 프로젝트를 참여하게 되었다.😭😭